Multivariate colormaps for n dimensions

Much work has been done in the last decade related to 1-dimensional colormaps (see for eaxmple Peter Kovesis paper and Nathaniel Smith and Stéfan van der Walts talk (2015)).

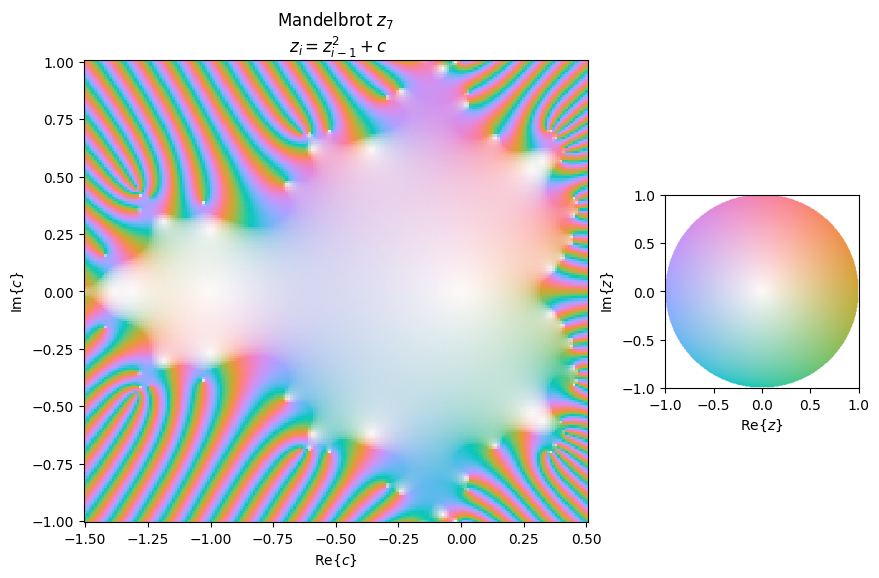
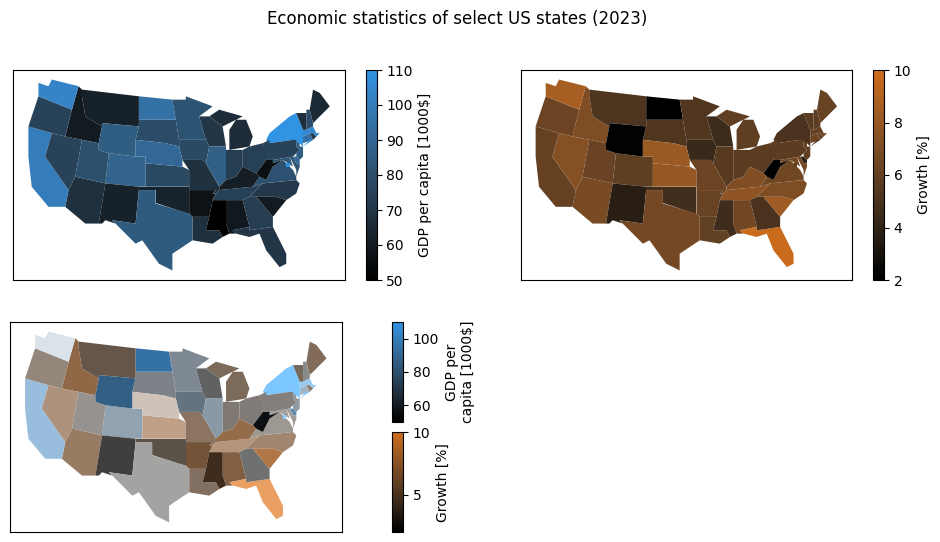
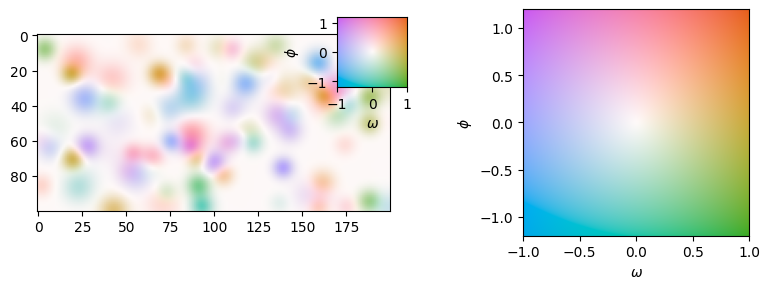
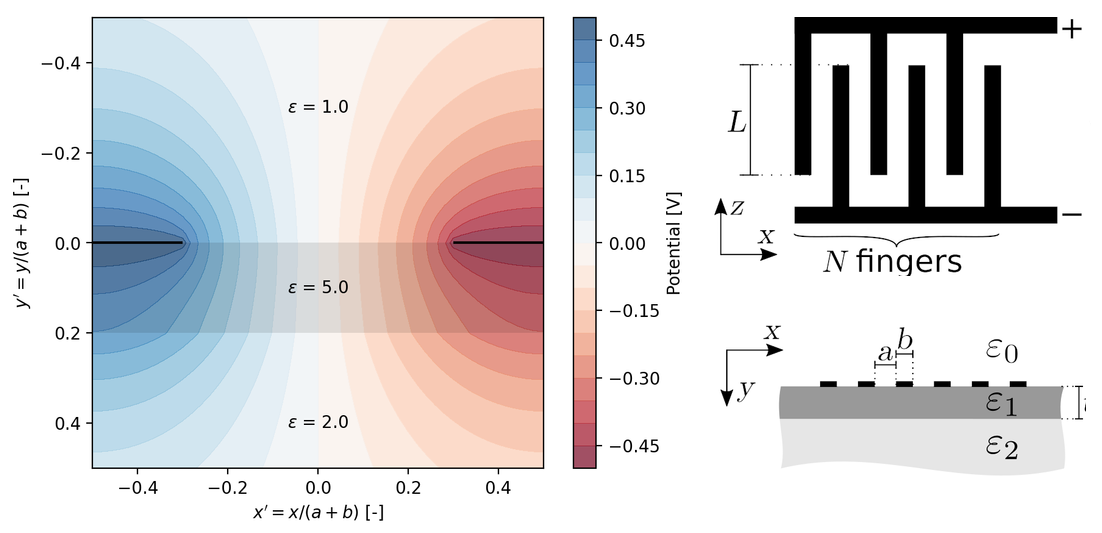
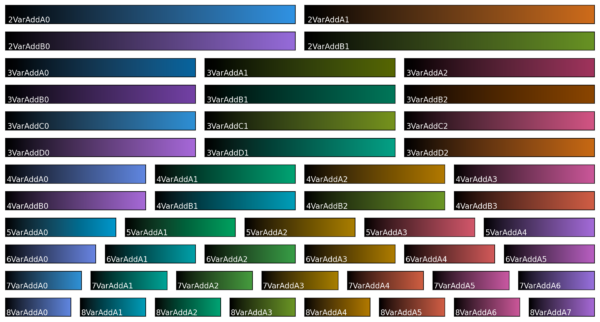
This post follows my previous post on 2D colormaps, and many of the design principles will be the same. However, with n ≥ 3, it quickly becomes unfeasible to create a full lookup table. With n = 3 channels and 256 values in each channel, the lookup table would be a matrix of 256^3 elements, likely much larger than the image the colormap is applied to. Instead, n independent 1D lookup tables are created, and the resulting colors are then combined.

Continue reading “Multivariate colormaps for n dimensions”
Featured post

Designing 2D colormaps

Two dimensional colormaps are seeing use in a number of domains that rely upon python ecosystem. I work with dark-field X-ray microscopy, which is one such domain, but there are numerous others, such as astronomy, polarization microscopy etc. While each domain may have dedicated tooling, darfix, astropy, xrayutilities etc, this tooling is built upon the scientific python stack, including numpy, scipy, pandas, matplotlib, plotly, etc. Since these domains share common challenges regarding multivariate colormaps, it would be ideal to handle these challenges upstream (i.e. in matplotlib, plotly, etc.) rather than in the domain-specific packages. In addition to the technical implementation, the design criteria for multivariate colormaps must be explored.

Continue reading “Designing 2D colormaps”
Featured post

Proudly powered by WordPress | Theme: Baskerville 2 by Anders Noren.

Up ↑