Colorstamps is a python package hosted on github and pypi for 2d colorstamps in defined as geometric shapes in the CAM02-LCD colorspace. Documentation at readthedocs. The package is inspired by the uniform colormaps in matplotlib, which has has greatly improved the visualization of scalar scientific image data.
The project contains a number of 2d colormaps (stamps), suitable for different data types, it is useful to distinguish between data of like-type, and data of different type, and also unimodal (only positive) and bimodal (positive and negative) data.

• If both axes are bimodal, and of like type, the axis should have a round shape with an origin in the middle, and ‘disk’/’cone’/’funnel’ are suitable.
• With one unimodal and one bimodal axis (i.e. intensity + phase shift etc.) ‘cut’ is a suitable colormap, and this exists in mulitple variations. If one axis is circular, ‘barrel’ loops on the x-axis.
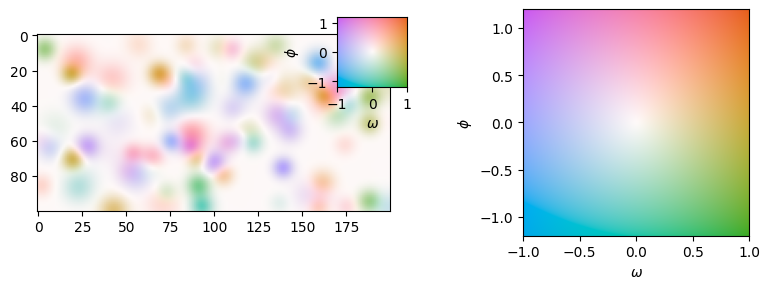
• With two unimodal axis, ‘orangeBlue’ is recommended.
Data outside the colormap must be projected into the valid space, and there are multiple options.

Finally, the RGB colorspace on a computer can only represent a fraction of the CAM02-LCD colorspace, and colorstamps will limit the colors in the colormap to fit the RGB colorspace. A tool for evaluation of 2d colormaps are included.

