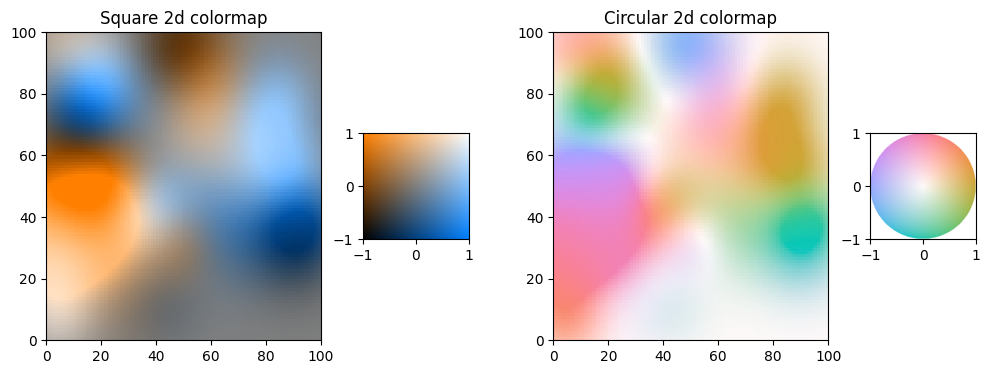
Color mapping with multiple channels has long been a requested feature in Matplotlib, one this Google Summer of Code project (GSOC) has attempted to address, the figures below shows the desired functionality:
While a complete solution for bivariate color mapping has not been merged to main at the time of writing, the intention is to have it in place for the 3.10 release of Matplotlib (~October 2024). This represents a delay of the project as compared to the original timeline, caused by a change in the scope of the project.
Originally, this GSOC project was based on replacing cm.ScalarMappable with a vector version,cm.VectorMappable, (relevant PR). However, with the involvement of the API lead @timhoffm and project lead @tacasawell it was decided to rework the data→color pipeline before implementing bivariate color mapping.
Color by numbers (advanced version)
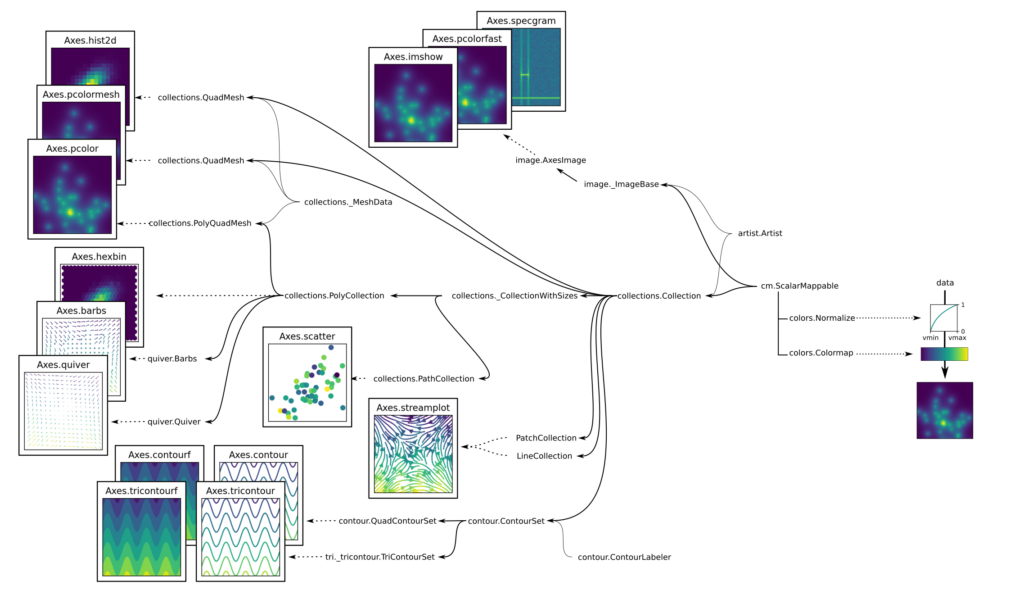
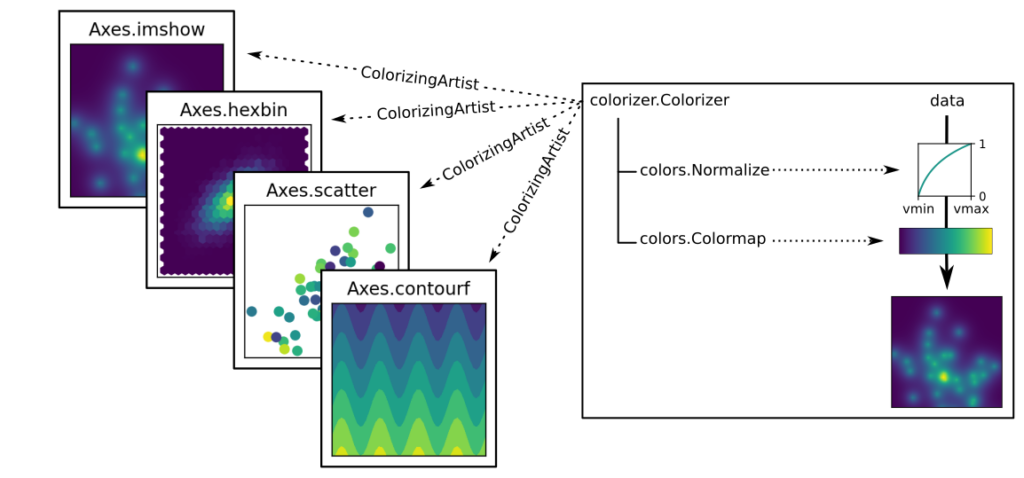
Representing data with color lies at the root of many of the plotting methods in Matplotlib. In practice, this is handled by the class cm.ScalarMappable which handles normalization (converting data to a 0-1 scale through colors.Normalize) and color mapping (converting the 0-1 encoding to colors through colors.Colormap). cm.ScalarMappable is therefore at the root of the inheritance tree, together with `artist.Artist`. The figure below shows all the top-level plotting methods that use the data→color transformation.
What @timhoffm argued was that the data→color pipeline may be shared by multiple elements in the same figure, but the current class hierarchy (subclassing cm.ScallarMappable) is not conducive to this use case, i.e. the user must manually add callbacks between different graphical objects to obtain functionality such as syncing the colormaps across plots
Changing the class hierarchy would have major positive implications:
- Increased functionality when working with multiple graphical elements that share a
data→colorpipeline - Simplify code maintenance separating the artist (graphical element) from the
data→colorpipeline¹ (i.e. more modular code) - Simplify the introduction of bivariate and multivariate color mapping
The proposed architecture change is as follows:
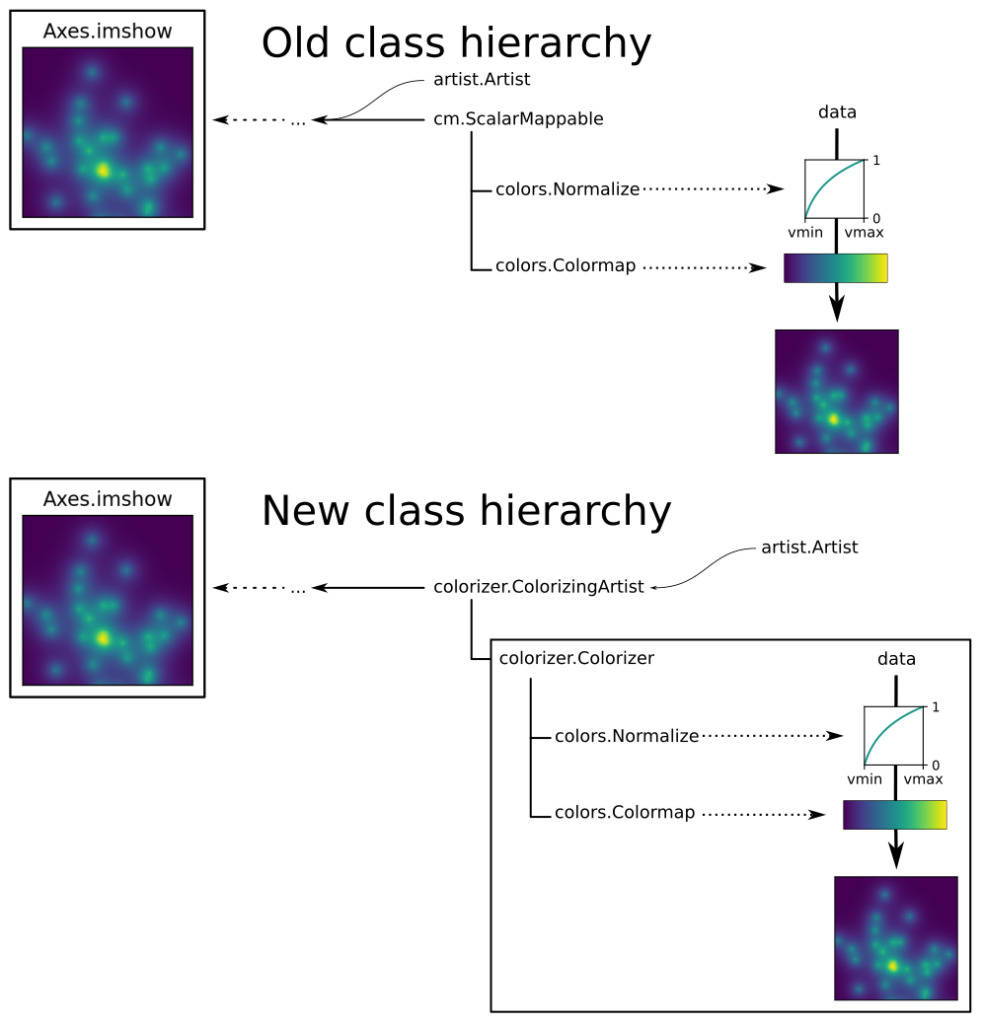
Where the data→color transformation is contained in the new colorizer.Colorizer module, and one colorizer can control the data→color pipeline for multiple plots:
These changes are implemented in the New data → color pipeline PR, and the (slightly outdated) video shows how multiple images that share a colorizer behave.
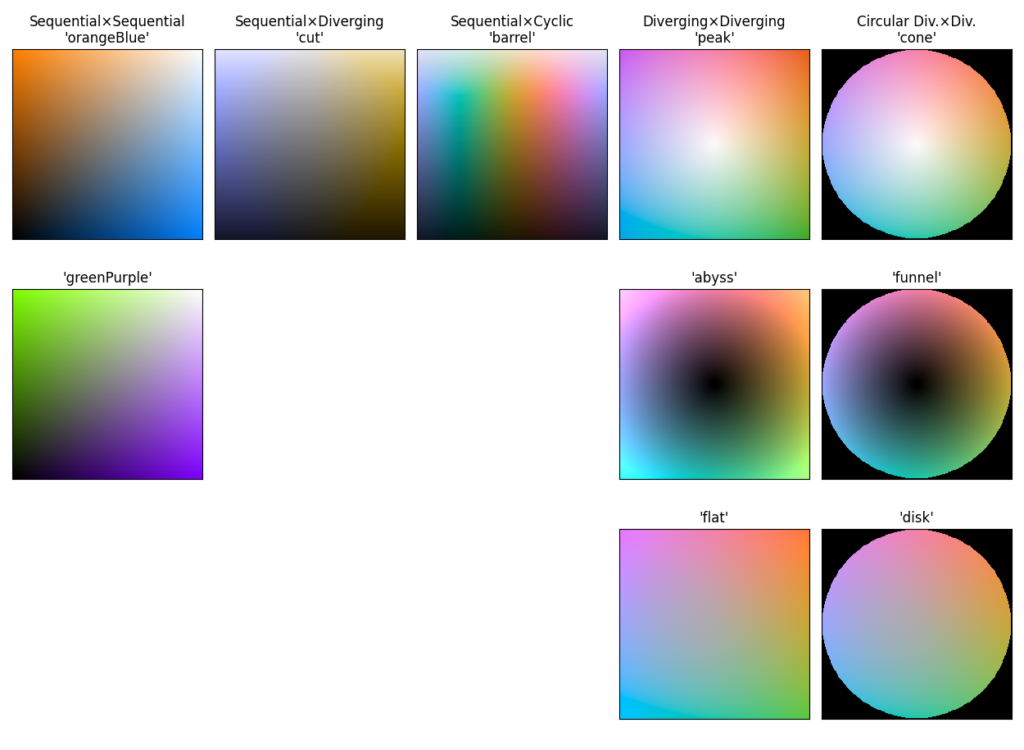
Colormap classes for bivariate (and multivariate) colormaps
A separate PR, MultivarColormap and BivarColormap, introduces classes that hold bivariate and multivariate colormaps.
The bivariate colormaps come in different shapes:
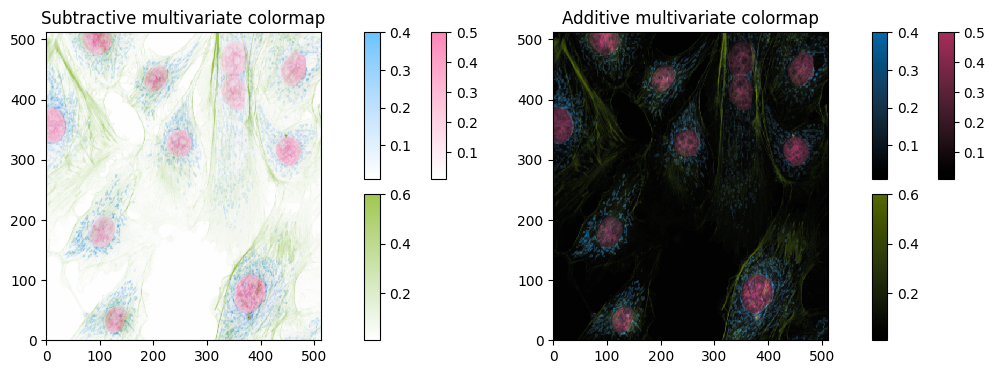
while the multivariate colormaps come with different combination modes:
Exposing bivariate (and multivariate) colormaps to plotting methods
Using bivariate or multivariate colormaps requires a multivariate normalization, so before the new colormaps can be exposed to users, a colors.MultiNorm class must be implemented. By using a colors.MultiNorm and a colors.BivarColormap with a colorizer.Colorizer object, the new functionality can be exposed to the top level plotting functions (i.e. ax.imshow()).
Both of these features exist as commits (links above), and will be part of a PR after the two other PRs are merged.
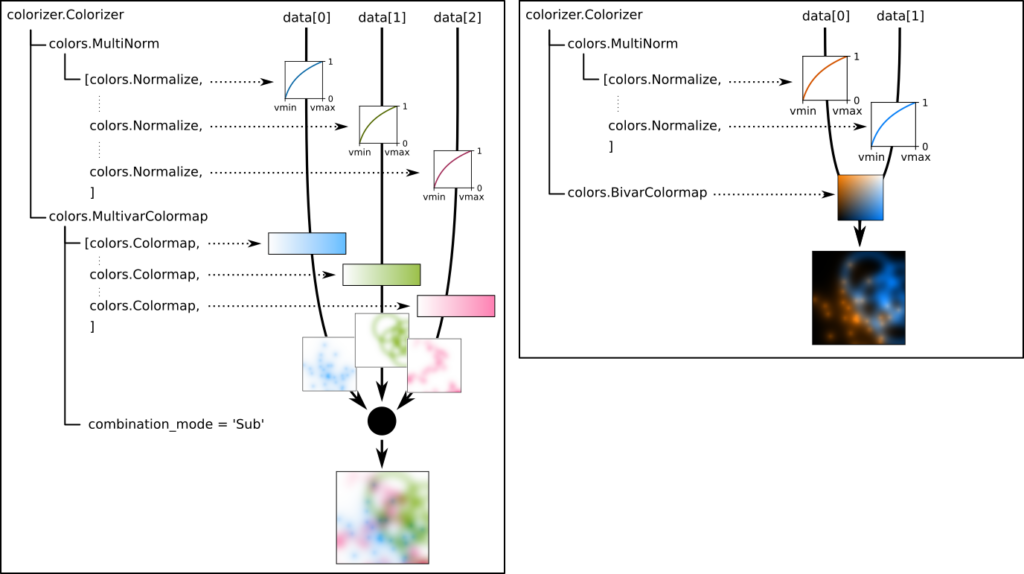
Combined with the functionality of the colorizer.Colorizer, this solution allows for coupled plots where a single axes from a bivariate or multivariate colormap can be used together with the full colormap:
Choosing bivariate and multivariate colormaps
Once the functionality is implemented, there needs to be colormaps for the user to choose from. I have written two blogposts describing the design considerations relevant for their design:
Multivariate colormaps for n dimensions
In an effort to separate different concerns, these have not been a part of PR#28454 MultivarColormap and BivarColormap, and will need to be introduced in a separate PR.
This should also feature a guide to how the new functionality can be used, and how to choose a colormap.
Colorbars
To complete the figure, a multidimensional colorbar must be added. There is a draft for this here, but some work still remains. Firstly, a BivarColorbar class must be created (in the multivariate case – a list of Colorbar objects will work). Secondly, the automatic positioning of the colorbars in the figure needs some improvement.
Summary
This project has grown in scope and now includes:
- Classes for bivariate and multivariate colormaps #28454
- Reworking the
data→colorpipeline#28658 - Exposing bivariate and multivariate colormaps to the plotting methods
- A selection of bivariate and multivariate colormaps
- “Colorbar” objects for the bivariate and multivariate case
Of these, step 1 has been approved, and step 2 is (hopefully) near the end of code review. Step 3 waits for step 1 and 2 to be merged, but the PR will be made soon. Step 4 is similarly ready, but the PR should be made after the code review of step 3 has started. The PR for step 5 will similarly follow once step 4 is merged.
In other words, there is still some work to be done, but as there exists drafts for all the remaining functionality the remaining workloads are less code-intensive, and instead lean towards the collaborative aspects of open source. This project involves re-organizing the data→color pipeline for all relevant plotting methods, and it is therefore important that all the Matplotlib maintainers get to chime in at every step of the way. This process takes time, but ensures a better outcome.
Thank you to Hannah and Kyle for guiding me through GSOC, and to Elliot, Tom, Tim and Jody for feedback on the PRs.
¹ The distinction between the Colorizer and ColorizingArtist objects are as follows:
-
ColorizingArtistsubclassesArtist, i.e. it refers to a specific graphical element in a plot. It has the following atributes:- data
- alpha (opacity)
colorizer- A
.draw(renderer)method to render (display) the graphical elements. - …²
- …³
-
Colorizerholds thedata→colorpipeline. It consists of:normcmap- A
.to_rgba(data, alpha)method that assignes color (red, green, blue, alpha) to data using thenormandcmap.
When rendering a ColorizingArtist, it will invoke self.colorizer.to_rgba(data, alpha) to determine what colors to render.
² ColorizingArtist also has attributes required of an Artist, such as position, size, etc. relating to rendering of the artist in an Axes.
³ The norm and cmap are accessible as attributes on a ColorizingArtist through the use of @property. For many users, the distinction between the ColorizingArtist and Colorizer will therefore not be felt.